good afternoon everyone ^^/
i know this weeks edition of the weekly budding designers tip is long overdue, so lets just get right to it!
today i will be doing an Easy Cable Chart tutorial, much like my Illusion Chart tutorial from a few weeks back. i mentioned in my last post that i had a new design i was going to be previewing here on my blog and submitting to the Knit Picks Independant Designer Program, and it just so happens it's a cabled pattern. in preparation for my impending submission i've taken some time to create an easy way to make cable charts that i could utilize in my own patterns.
if you do a google search for "cable chart tutorial" you'll come up with a number of sites that explain, in no easy terms, how to write out cable charts. if you're a budding designer with limited chart-making experience, or just a knitter who has a great idea for a cable design and wants to chart it out, these tutorials can be a bit overwhealming. my chart technique is a much simplified version that just about anyone should be able to do!
Easy Cable Charts:
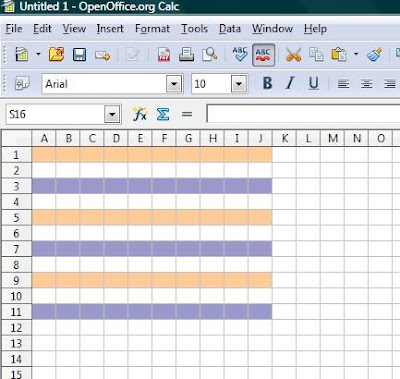
before we get started with the Cable Chart tutorial i suggest you read through my previous Illusion Chart tutorial. to make a Cable chart i'll be using the same software and most of the same techniques i used in the last tutorial.
- first things first, if you don't already have a spreadsheet program you're going to need one to make your Cable chart. you can head on over to openoffice.org and download a free version which is the version i'll be using.
- next we'll be opening a new document and adjusting the cell width just like in the Illusion tutorial. for a cable chart i like to use a slightly bigger cell width than for an illusion chart, about .43" (make sure to highlight the area for your chart before adjusting cell width or it won't work.) once you've adjusted your cell width, you're ready to begin charting.
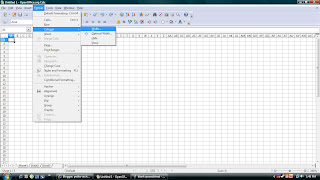
{click on "Format" and then go to "Columns" and "Width" to adjust}
- the last technique i'm going to use to make my cable chart is merging cells. this really couldn't be any easier as OpenOffice has a fantastic little "merge cell" button right at the top of the page
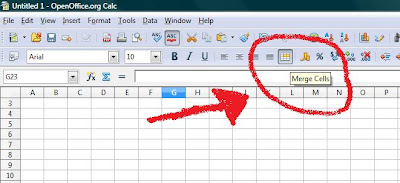
{the location of the "Merge Cells" button}
- now that we've got our column width adjusted and we've learned how to merge cells we're going to start creating our cable chart. i've chosen to demonstrate a simple 2 x 2 twisted ribbing:

- since this pattern calls for columns of simple reverse stockinette, i'm going to start by shading those columns in grey and when i make the key for my chart i'll indicate that grey stitches should be purled on the right side and knit on the wrong side.
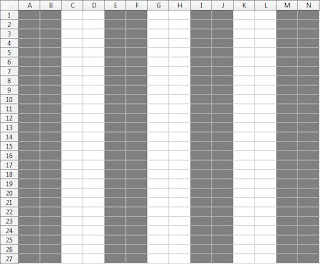
- next i'm going to create my symbols for the cabled stitches. i'll start by finding all the cells that will have cable symbols, merge them and add borders (note: merging and bordering is actually not mandatory, but i like the look it gives to my finished product and feel it makes my charts easier to read. if you want an even simpler way to chart you can skip his step entirely.
- once i've merged and bordered my cells its time to add my cabling symbols. i'm going to be using the simplest symbols of all; slanted lines. these slanted lines will indicate that these stitches need to be cabled with a right front crossover on the RS and a right back crossover on the WS. when i'm finished my chart will look something like this:
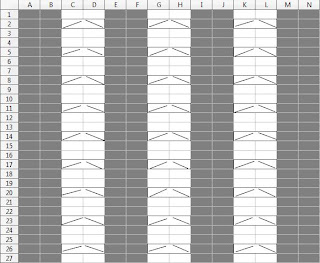
- now that my chart is finished all that's left to do is make a key or legend for my chart just like i did for my illusion chart, and that's all there is to it!
now here's the fun part:
the main concept behind charting is using symbols to represent certain stitches or techniques. this means as long as you use a key or legend to explain your symbols, you can use pretty much any symbols you want! do you want a row of 4 smiley faces to represent a 2 stitch cable crossover? go for it! for many years now designers have been using the same old symbols to represent the stitches used in cabling and lace making, so why not change it up a bit? for the purposes of this tutorial i've kept the symbols in my chart very simple, but i'd like to encourage all the budding designers out there to not be afraid to deviate from the norm. take control of your knitting and your design process and make it your own. differentiating yourself from the pack is a great way to get noticed as a designer :)
thanks for checking out my Easy Cable Chart Tutorial, i hope this will be helpful to some of you out there who are wanting to venture into the realm of chart making, but are maybe a bit daunted by the task. hopefully i've shown you how easy it can be and that anyone can do it!
peace & love to all
~Carla

 since i first embarked on this journey, i've learned a lot about the design process, the tips and tricks of the trade . this weekly segment is my way of giving back and helping out other budding designers like myself by sharing my knowledge.